Apple Inc. (NYSE: AAPL) has been delivering strong returns over the last years including in 2019 and 2020 and Q1-Q2 2021. At its height, at the end of January 2021, Apple stock price had risen by 208%, YoY and 8% YTD. By August 11, 2021, the stock price had risen by 31% YoY and 17% YTD. The stock has built momentum, following the increasing market volatility and other dynamics in late Q1 and early Q2, 2021. AroniSmart™ team, leveraging the Machine Learning Time Series capabilities, including Support Vector Machine, and Dominance Analysis of AroniSmartIntelligence™ and AroniSmartInvest™, has looked at the trends of the stock price of AAPL vs the stock prices of 8 selected companies between Q3 2020 and Q3 2021 and came up with insights and projections on the dynamics. The insights are presented below (for disclaimer and terms, check AroniSoft website).
A little bit of the usual investment research before coming back to AroniSmart™'s findings.
Apple Momentum
Apple Inc. (NYSE: AAPL) has consistenly delivered strong returns since 2017. Following the deep analysis of March 2021 (See: AroniSmartIntelligence™ in Action: Apple (AAPL) Stock Performance Support Vector Machine and Dominance Analysis in Q1 2021), Apple stock has increased by 28%, despite increased volatility in some periods.
Apple stock dynamics appear to have moved beyond or factored in the factors that were affecting the overal market in early 2021, such as COVID-19 pandemic, the last US general elections, the uncertainty on the job market, the growing inflation, and the economic policies. The factors impacting Apple stock performance appear to be: dynamics within the TECH sectors in general, Apple's 5G innovation including the launch of iPhone 13 expected in September 2021 with A15 chip and improved batteries, Apple TV+ expansion, continued rumors about Apple investment in EV (see What is Expected from Apple in the near future: Self-Driving EV Car, New Macbook Pro, Mac Mini, and MacBook Air?).
Advertisement
GET ARONISMARTINVEST, A LEADING INVESTMENT RESEARCH TOOL, BASED ON Advanced Analytics, machine Learning and Data Science on App Store -- click here 
New Products at Apple
Since 2017, Apple has heavily invested in new technologies and products, including new chips and 5G. The innovations have been the center of Apple's performance and projections.
Beyond A15 chip, a faster system-on-a-chip in the next iPhones, Apple has been driving the adoption of 5G technoolgies in all its iPhones. In February 2021, iPhone 12 Pro Max was named the most popular 5G smartphone in the United States of America. In the USA, iPhone 12 models feature ultra-fast mmWave 5G in the US. It is belived that the upcoming iPhone 13 models could expand mmWave into most countries.
In December 2020, media reports confirmed that Apple was working on EV and targeting 2024 for production, with a more advanced battery technology. Independent EV remains a distant reality for Apple, but there are also rumors that Apple may partner with a car maker to accelerate the timelines.
Since January 2021, Apple has released the 24-inch iMac, new iPads, new Mac Mini, the new Apple TV, and AirTags. In the very near future, it is expected that Apple will release new iPhones, MacBook Pros, and probably many more products built on the latest technolgies.
Based on all these factors, over the last years and quarters, AAPL has consistently outperformed several technology companies and other stocks. Then in early January 2021, Apple, as many TECH stocks accelarated their upward momentum. The momentum was halted in early February 2021 and May 2021. The momentum resumed without significant interruption in since early June 2021.
AroniSmart™ team analyzed Apple's stock performance dynamics, leveraging the Support Vector Machine and Dominance Analysis capabilities of AroniSmartIntelligence™ and uncovered interesting insights, as shown below. The team analyzed the performance of AAPL vs 9 other internally selected stocks from August 11, 2020 to August 11, 2021.
AroniSmartIntelligence™ Analysis: Apple continued to exhibit behaviors similar to those of several stocks, but with an high momentum.
From the analysis, it was found that most of these stocks basically follow similar trends. Also, they are all impacted by the market conditions. However, the analysis found important nuances.
The key findings highlight with a positive view: most of the stocks studied had an upward momentum over the period. However, like the general stock market, they faced a slowdown and high volatility in late Q1-Q2 2021 before starting a bounce back. Trendwise, since June 2021, the stocks have been on fueled momentum reaching high or record price levels. The upward moementum accelerated in June and July 2021, for most stocks.
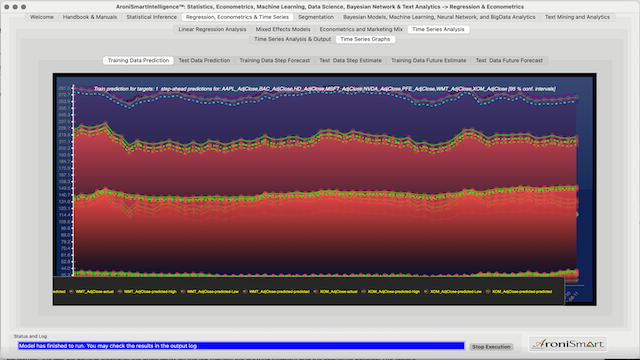
Figure 1: Key Stocks Price Trends in Q2-Q3 2021 -- Training Data model.

Figure 2: Key Stocks Price Trends in Q2-Q3 2021 -- Test Data model.
Over 2021 Apple (AAPL) built on an earlier momentum, beating most of the stocks under the AroniSmart study.
By July of 2021 most stocks were above the average Q1 2021 levels. In early Q2 2021, Apple's momentum was significantly impacted by the market conditions. In late May 2021, it bounced back (see chart below). Since then, the Apple stock has maintained the momentum.
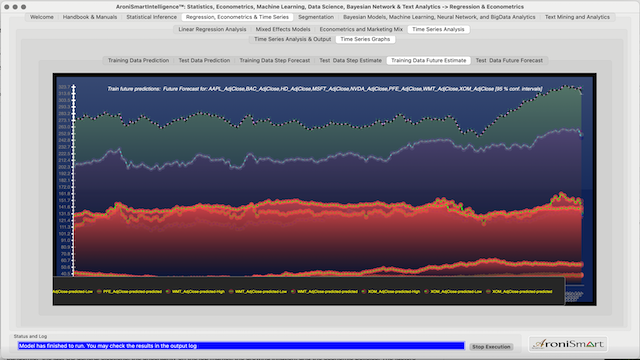
Figure 3: Key Stocks Price Trends since August 2020 -- Test Data model estimates
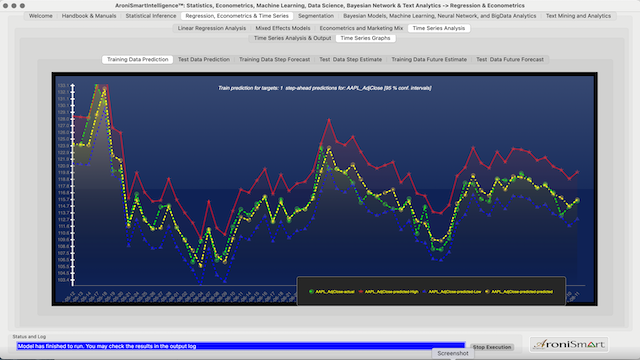
Figure 4: Apple Stock Price Trends and AroniSmart Projections Analysis Between Jan 2021 and May 2021
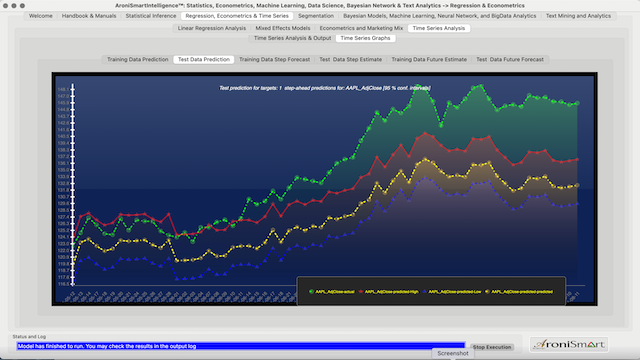
Figure 4: Apple Stock Price Trends and AroniSmart Projections Analysis Between May 2021 and August 2021
AroniSmartIntelligence™ modelling shows the prices of the stocks that appear to mirror each other: a high opening for the stocks that tends to lead a decline or slow down in Apple's closing price and a high opening for the stocks that tends to lead an increase or growth in Apple's closing price. Late Q2 - Early Q3 dynamics dynamics appear to positively impact Apple's prices, whereas the end of Q1-early Q2 2021 appears to have been challenging.
AroniSmartIntelligence™ analysis, using Support Vector Machine modelling, below shows the weights of the different stocks, with XOM and LOW being on the negative side, HD, WMT, BAC, MSFT, NVDA on positive side and LOW and PFE on the neutral side.
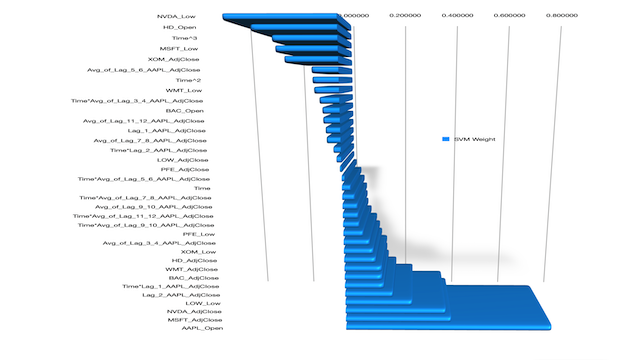
Figure 5: Apple Stock Price Dynamics - AroniSmart Support Vector Machine Analysis Results on the Period Between August 2020 and August 2021
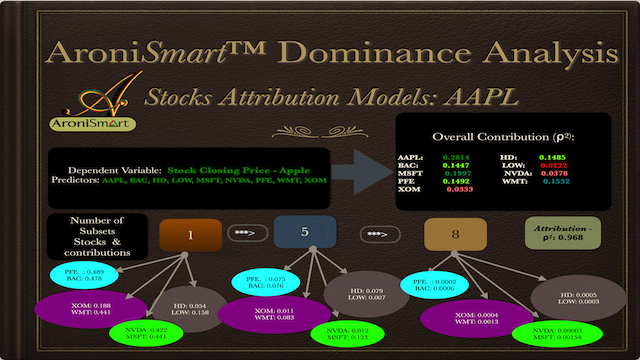
AroniSmartLytics™ Dominance Analysis confirms Support Vector Machine results: Apple momentum impacted in 2021 and not aligned with the momentum of most of other stocks.
AroniSmart™ team analyzed Apple's performance dynamics using Dominance Analysis capabilities of AroniSmartIntelligence™ and uncovered insights confirming the performance dynamics of AAPL vs 8 other internally selected stocks from August 2020 to August 2021. See below:
More detailed analyses can be conducted using AroniSmartIntelligence™ Big Data, Machine Learning, Time Series and Sentiment Analysis capabilities.
For more on AroniSmartIntelligence and AroniSmartInvest capabilities, visit AroniSoft web site by clicking here. AroniSmartInvest™ and AroniSmartIntelligence ™ are available on Apple's App Store.
Advertisement
GET ARONISMARTINTELLIGENCE™ on App Store
AroniSmartIntelligence™, the leading tool for Advanced Analytics, Machine Learning & Data Science
Statisticians, Data Scientists, Business and Financial Analysts, Savvy Investors, Engineers, Researchers, Students, Teachers, Economists, Political Analysts, and most of the practitioners use Advanced Analytics to answer questions, to support informed decision making or to learn.
AroniSmartIntelligence™ is a leading Advanced Analytics, Machine Learning and Data Science tool, with optimized cutting edge Statistics models, Econometrics, Big Data and Text Analytics.
AronismartIntelligence™ includes modules covering Machine Learning and Big Data mining, Unstructured Text Analysis, Sentiment and Emotion Analytics, Bayesian Statistics and other advanced analytics.
©2021 AroniSoft LLC.


