


Why NON LINEAR MODELS, ECONOMETRICS AND MARKETING MIX ANALYTICS MODELS?
With the latest advances in high technology, marketing and advertising and investment research have been going through a revolution. Advertising to consumers has changed significantly. The touchpoints drive consumers to compare and make purchase decisions based on the messages they receive on their smart TV, smartphones, desktops, laptops, and tablets. This is on top of other media, such as Radio, Print, Direct Mail, etc. However, it is not just marketing touchpoints that drive consumers. Economic factors, trade and merchandising, consumer promotions, price, and other factors play a major role, usually synergistically.
At the same time, companies' performance and how that performance translates into the stock market price have become a complex subject to grasp for investment researchers.
ARONISMARTINTELLIGENCE: TOUCHPOINTS, ECONOMIC FACTORS, NON MARKETING FACTORS AND SYNERGY.
Increasing key questions have been around on how to capture and understand the synergies among factors driving consumers purchase, companies performance and market dynamics. Understanding and answering these questions help marketers, media strategists, investment researchers, investors, and market researchers to know not only which marketing campaigns are the most effective and which factors drive performance, but also the synergies that drive sales, effectiveness and performance. With that information:
- decision makers will have better insights on where to focus marketing investments and drive brand and sales growth.
- investors and investment researchers will able to better understand and possible predict company performance and stock prices.
That is where advanced analytics and machine learning, especially advanced analytics tools, like AroniSmartLytics™ (AroniSmartIntelligence™), come in. For that purpose, AroniSmartLytics™ now includes a module focusing on General Non Linear Models and Marketing Mix Analytics.
WHERE ARE THE NON-LINEAR MODELS IMPLEMENTED.
General Non Linear Models are implemented in the Regression, Econometrics and Time Series module of the new version of AroniSmartLytics ™ or AroniSmartIntelligence™ available users.
NON LINEAR MODELS, ECONOMETRICS AND MARKETING MIX ANALYTICS MODELS IN in AroniSmartIntelligence?
Econometrics Models controller in AroniSmartLytics contains a series of models used in Econometrics. The econometrics models include 2 types: Linear Models and Non Linear Models.
The linear econometrics models included are:
- Count Data: Poisson and Negative Binomial
- Logistic Regression,
- Logit,
- Probit,
- Tobit,
- Interval,
- Weighted Least Squares,
- Ordinary Least Squares (OLS).
Some Econometrics Models, such as Logistic Regression, and OLS may be run outside Econometrics Models module.
Each Econometrics model may have its own options that should be set before running the model.
For example:
- Count Data Models require selecting the distribution: Poisson, Negative Binomial, etc.
- Probit requires the user to choose among the following distributions:
- Binary
- Ordered
- Random Effects
- Logit has the following choices are: Binary, Ordered, and Multinomial.
The Non Linear Econometrics models included are:
- General Non Linear Models,
- Generalized Logit Models,
- Generalized Quadratic Models,
- Multiplicative Models and
- LogLog Models.
TRANSFORMATION OF VARIABLES OF NON LINEAR MODELS IN ECONOMETRICS AND MARKETING MIX ANALYTICS MODELS
Econometrics Models module includes a data transformation capability. With the capability it is possible to transform both marketing variables having carry over effects and other variables, to get the variables more suitable to modeling and to capturing econometrics dynamics and assumptions.
Customized transformation, including log, common statistics such as mean, mode, median, standardized variables, etc. or based on customized expression may be done before running the model.
During the transformation of marketing variables, the user set up some parameters, including decay rate, build weeks, saturation and threshold. The configuration file is created and can be save for a manual edit. The edited configuration file needs then to be loaded, before running the actual file transformation.
Econometrics Transformation Steps
- Load a dataset in Aroni format, though the Welcome Module
- Navigate to Regression, Econometrics & Time Series
- Select Econometrics sub module
- Select Variables Transformation.
- Select variables (Dependent, Time, Media and Other Marketing, Non Marketing and Cross-Section
- Select the parameters
- Click on Create Configuration, to create the configuration file. The configuration file shows in the output browser
- Click Save the Configuration, to save the configuration file
- Open and manually Edit the Configuration file, as needed.
- Click Load Configuration, then Set Parameters.
- Click Run Transformation to create the transformed data set. Save the dataset for further Econometrics modeling.
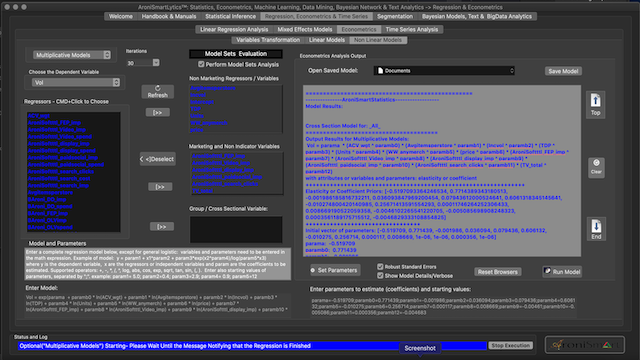
Running the Non Linear Models and Getting the Results
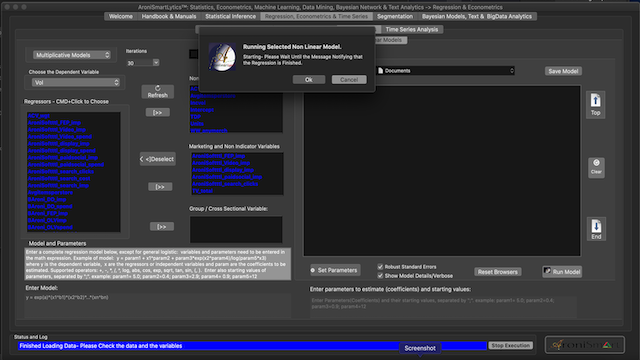
Running the model:
Once the model is setup, click “Run Model” button to run the model.
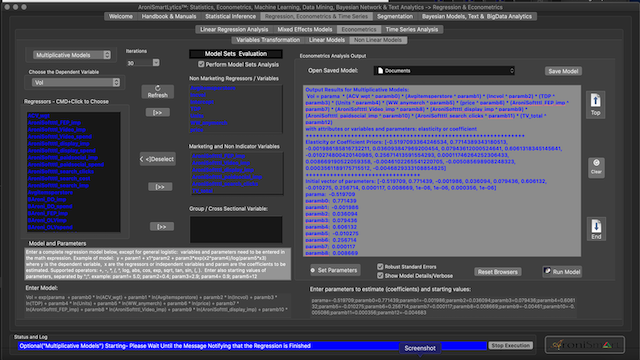
Output Viewer.
The text viewer that occupies the right center is where all the statistics produced in the sub-module are output.
The data shown in the output may include ANOVA tables, data, predictions, the statistical tests, including covariance, F-test, AIC/BIC values, R-Squared, MAPE, p-values, etc.
When Perform Model Sets Analysis option is selected, the tool performs the model sets evaluation, if the selected non-linear models are Multiplicative Models or Log-Log Models. Depending on the number of the variables selected, all the potential subsets or a the subsets with a large number of variables are analyzed.
The Output Viewer is editable and can be cleaned by highlighting and deleting a small or large portion. The users may also add their own comments. The controls on the right allow easy navigation.
AroniSmartLytics™ (AroniSmartIntelligence™) is a leading advanced analytics, machine learning and data science tool, with optimized cutting edge statistics models, Econometrics Models, Big Data and Text Analytics.
AroniSmartLytics™ (AronismartIntelligence™) includes modules covering machine learning and Big Data mining, Unstructured Text Analysis, Sentiment and Emotion Analytics,Econometrics, Marketing Mix Analytics, Bayesian Statistics and other advanced analytics.
GET ARONISMARTLYTICS and AroniSMartInvest on App Store